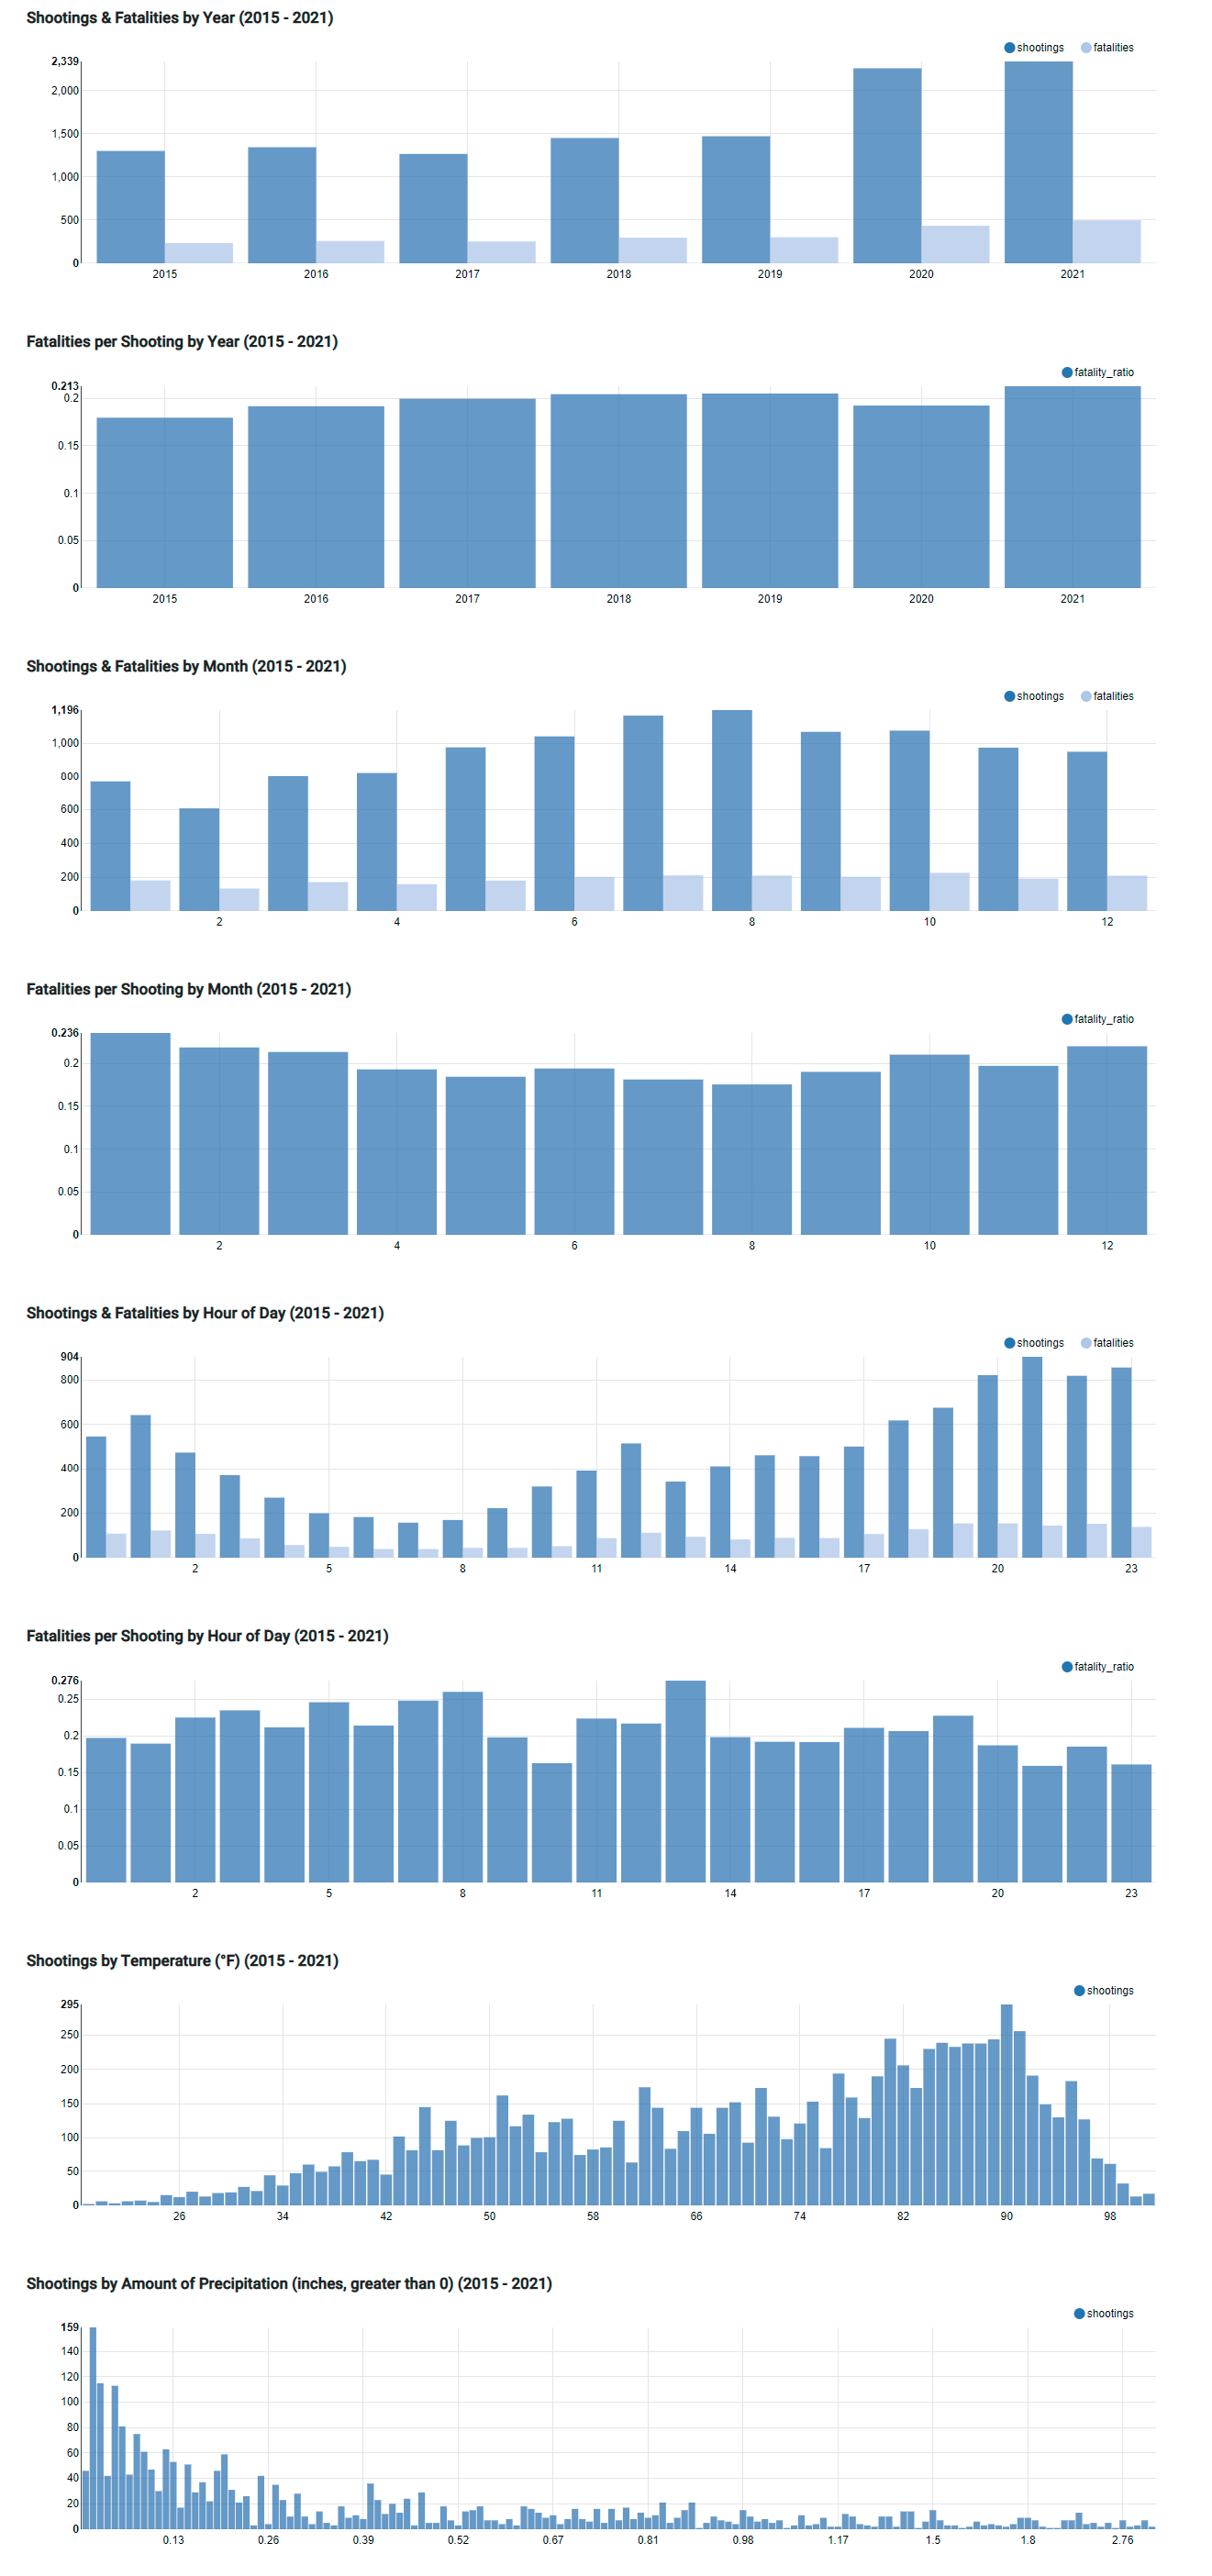
This dataset provides a succinct record of shootings in Philadelphia, including the number of shootings and fatalities from 2015 through 2021. The data is organized by year, month, and hour of the day, allowing for a detailed analysis of patterns and trends. In addition, this dataset has been enriched with information such as shootings by temperature and amount of precipitation, providing greater insights into the circumstances surrounding these tragic events. We hope this dataset can be a valuable resource for researchers, analysts, and policymakers seeking to understand and address gun violence in Philadelphia.
This data was originally sourced from the City of Philadelphia government via Open Data Philly and has been enriched with additional weather data to provide greater insights.
Sample Data Scroll table horizontally to view more
This dataset is best suited for academics or community organizers in the higher education/research industry who are looking for unique insights into gun violence trends in Philadelphia.
The suggested use cases for this dataset include:
See the trend of shootings and gun fatalities in Philadelphia since 2015
Breakdown shooting data by month and time of day
Visualize the impact of rain and temperature on the number of shootings and fatalities in the city
Inform research or advocacy work to reduce gun violence in Philadelphia or elsewhere
Enrichment Options
We utilize state-of-the-art AI and machine learning to enrich datasets further and provide predictive analytics for your important KPIs. Get in touch to learn more.
Enrichment opportunities for this dataset include:
Blend data with other data sources for additional insights
Use data to train a machine learning model or to perform predictive analytics
We can provide additional services such as blending this data with your internal data, applying predictive analytics, and more. Get in touch to learn more.
Sample Data Scroll table horizontally to view more
year
shootings
fatalities
fatality_ratio
2015
1302
234
0.1797
2016
1345
258
0.1918
2017
1267
253
0.1997
2018
1452
297
0.2045
2019
1472
302
0.2052
2020
2260
435
0.1925
2021
2339
498
0.2129
Who Is This Data For?
This dataset is best suited for academics or community organizers in the higher education/research industry who are looking for unique insights into gun violence trends in Philadelphia.
The suggested use cases for this dataset include:
See the trend of shootings and gun fatalities in Philadelphia since 2015
Breakdown shooting data by month and time of day
Visualize the impact of rain and temperature on the number of shootings and fatalities in the city
Inform research or advocacy work to reduce gun violence in Philadelphia or elsewhere
Enrichment Options
We utilize state-of-the-are AI and machine learning to enrich the datasets further and provide predictive analytics for your important KPIs. Get in touch to learn more.
Enrichment opportunities for this dataset include:
Blend data with other data sources for additional insights
Use data to train a machine learning model or to perform predictive analytics
We can provide additional services such as blending this data with your internal data, applying predictive analytics, and more. Get in touch to learn more.