Integrating Data From an Enterprise With Multiple Websites
Industry: University-Based Health Care Website Type/Size: Lead Generating/>10K Monthly Visitors Services Performed: Enterprise Analytics Reporting
Where We Started
Our client wanted a better way to analyze their complex network of websites. They had 50+ service lines managing an equal number of separate sites, all with different content strategies and disconnected analytics. This set-up provided a ton of isolated performance data but nothing holistic enough to create a coordinated content strategy. It was hard for our client to know if their sites were competing against each other or creating confusion for users. And, as data grew, everything became more and more tangled.
What We Did
We built a custom reporting tool that could organize and process disparate data sets. When we connected the tool to our client’s network of websites, they were able to see new patterns of commonality and divergence. It synchronized the entirety of their information and identified areas of global concern/opportunity without any loss of historical data or the ability to micro-measure.
How We Helped
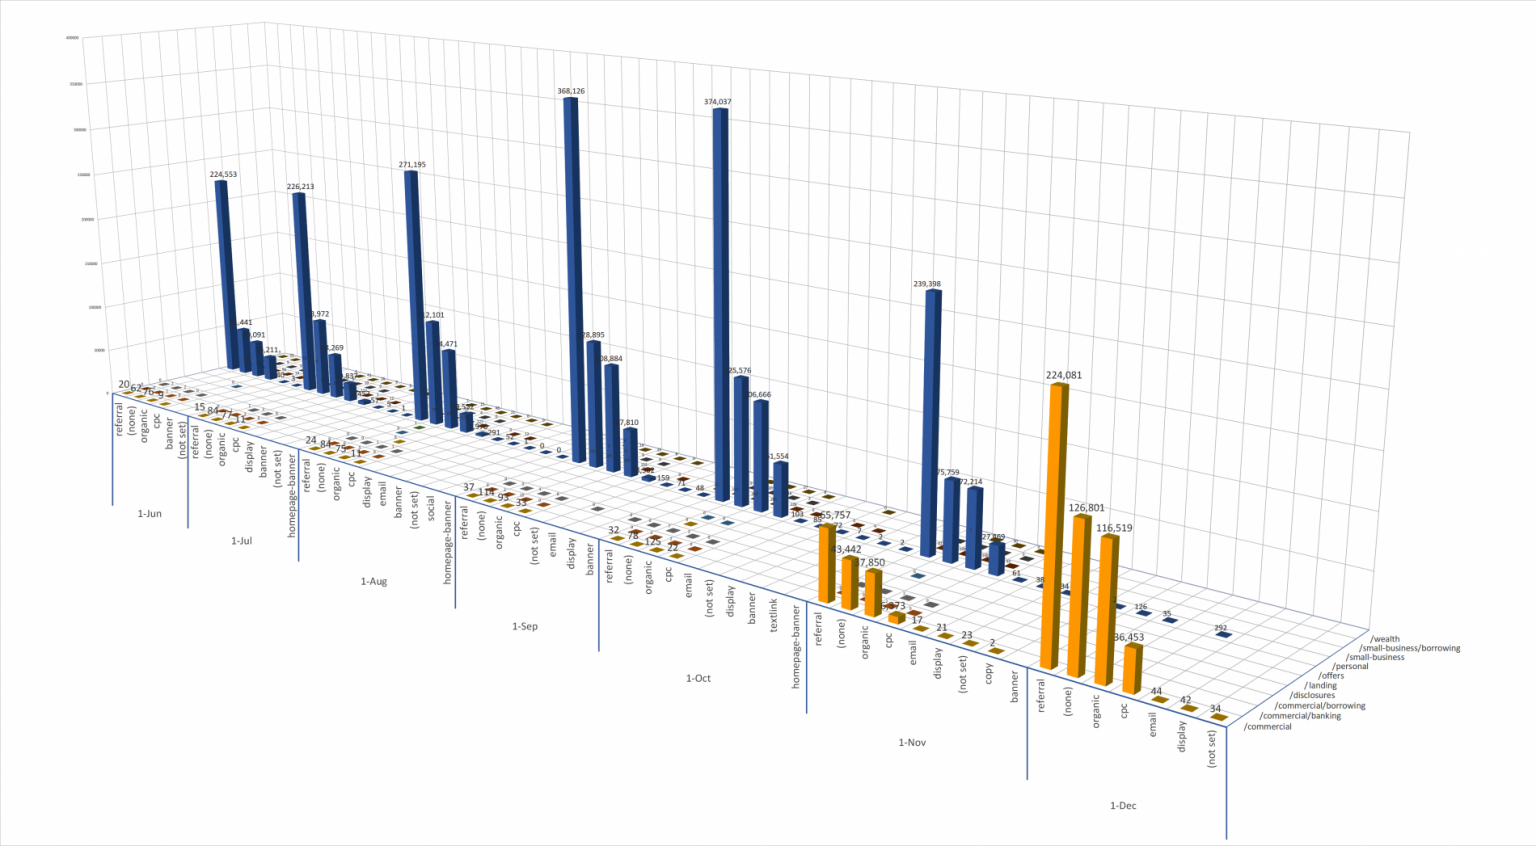
Our work delivered new KPI reports that are fully consolidated and much more powerful (see sample image, below). It is now possible for our client to accurately follow consumer journeys and create content strategies with confidence. The new reports also shed light on previously hidden data points that provide actionable intelligence.
INTEGRATED TRAFFIC DATA (PRE- AND POST-CONSOLIDATION)
The above chart shows traffic data for multiple sites that migrated content and consolidated analytics. Click here to contact us and learn more about the various KPIs and business insights our Enterprise Analytics Reporting service provides.