
Updated: Jul 28, 2016
Auction Insights report in Google AdWords is a powerful tool which lets you compare your AdWords performance to other advertisers and competitors participating in the same auctions as you are. This information can help you make decisions to improve your AdWords performance.
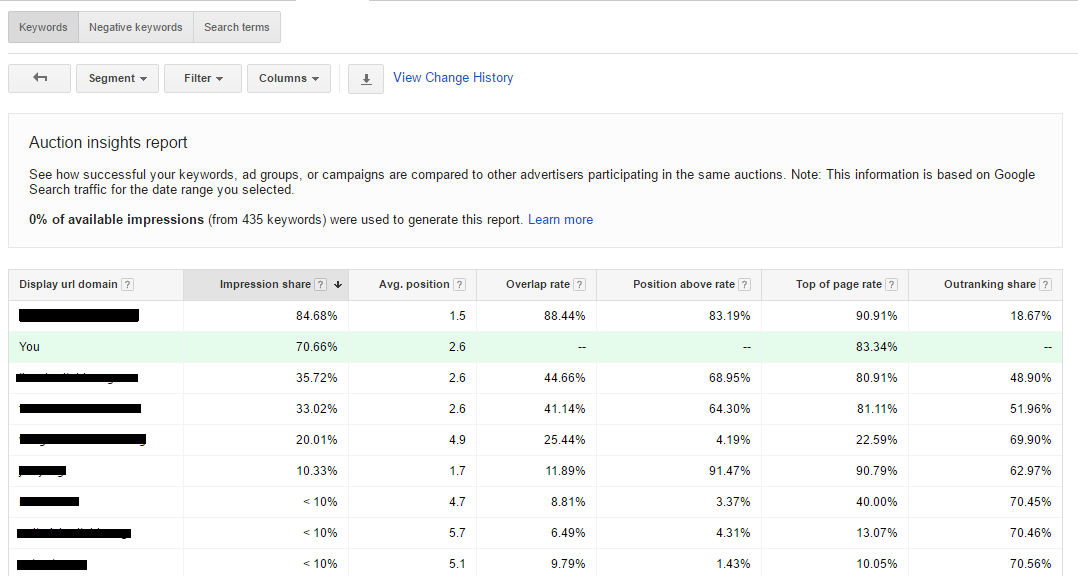
SAMPLE AUCTION INSIGHTS REPORT
The Auction Insight Report tracks the following metrics:
-
Impression Share
– Is the number of times your ad is fetched or displayed divided by the estimated number of times your ad was eligible to be displayed. Eligibility of ads is based on target settings, quality scores of ads and approval statuses.
In the auction insights report, this metric shows how often a competitor’s ad was fetched, as a proportion of the auctions in which you were also competing.
-
Avg. Position (search campaigns only)
– This is the average rank of the ad in the auctions on the search results page. For example if one of your competitors in your Auction Insights report is showing a “3” in the Avg. Position column, this means the competitor’s ads showed on average, in 3rd place on the search results pages where your ad is also showed.
-
Overlap Rate
– This is how often your competitor’s ad was displayed when your ad was also displayed. For example, if your competitor has an “88.44 %” overlap rate, it means about 88 out of 100 times when your ad was displayed, your competitor’s ad was also fetched.
-
Position above rate
– This metric is only available for Search campaigns. The metric shows how often your competitor’s ad was shown in a higher position than yours on a search results page when both ads were shown at the same time. For example, if your competitor has a Position Above Rate of “83.19%”, it means their ads were showed in a position above yours 83.19% of the time when both ads were displayed.
-
Top page Rate
– This metric shows how often or the percentage your ads and the competitor ads were shown above unpaid (organic) search results or the top of the page.
-
Outranking share
– is defined by Google as the number of times your ad ranked higher in the auction than another competitor ad, plus the number of times your ad showed when theirs did not, divided by the total number of ad auctions you participated in.
((Number of Times your a ranked Higher than Competitor + Number of Times your ad showed when theirs did not)/Total number of ad auctions you participated in)* 100
If you’re looking for a PPC agency to manage your campaigns and maximize ROI, FourFront can help. As certified Google Ads specialists, we provide strategies that will take your business to the next level. Contact us today for a free consultation.


One Comment
Insightful article
Comments are closed.