Position #1 on Google isn’t what it used to be. How people engage with the search engine has evolved drastically over the past 4 years. For many reasons Google continuously tests changes to their results pages to see what yields the visitor behavior they are looking for. The effects these changes have over time on ranking position and Click-Through-Rate can provide good insights. This analysis shows the change in the distribution of clicks for the top 12 impressions on Google based on ranking position.
How people engage with the search engine has evolved drastically over the past 4 years. For many reasons Google continuously tests changes to their results pages to see what yields the visitor behavior they are looking for. The effects these changes have over time on ranking position and Click-Through-Rate can provide good insights. This analysis (data below) shows the change in the distribution of clicks for the top 12 impressions on Google based on ranking position. In 2016, most clicks happened in at top positions, however, in 2019 clicks are more evenly distributed over all ranking positions. This data challenges the norm by suggesting that position #1 is not what it used to be. This is part two in our series: What Does a Google Rank Mean for your Business? Read Part One, if you haven’t already.
Where your website is ranked on Google for a given keyword vs. the expected Click Through Rate is an important metric to know when providing SEO services. This data helps set expectations for the services your clients are purchasing from you. If you were to Google CTR by google SERP position the top results include charts with smooth even downward curves showing the correlation between CTR and ranking position. From my experience this curve is not so smooth and CTR by ranking position changes with keyword intention, audience demographics and many other factors.
I wanted to run my own analysis on this in an attempt to calculate the variation in visitor count a change in ranking position would have. The only dataset available to me that could be used for this analysis is Google Search Console. This data source does provide query, average ranking position, the number of clicks and impressions, the impression URL, type of impression (image, web or video), device and protocol. Google does provide the disclaimer that “To protect user privacy, queries that are made infrequently or that contain sensitive or personal information are grouped together as (other).” meaning it’s an incomplete data set, but it’s what we have to work with.
The data available from Search Console has changed over the years. Specifically, how impressions are counted has not been consistent. If you look at your Search Console data for August of 2018 you will likely see a sharp increase in the number of impressions being reported while the number of keywords remained consistent. I don’t know why this increase happened, but it did coincide with a change in the amount of historical data that would be available in Search Console. At that time Google changed from three months of back data to 16 months.
Search Console data provides metrics such as the query (a.k.a. keyword), average ranking position, the number of clicks, the impression URL, type of impression (image, web or video), device and protocol. The average ranking position is probably the least accurate metric because the ranking for the same keyword can change based on many factors such as searchers proximity to what is being searched for, however, I will use this metric for my analysis.
The Findings
I used Search Console data for September 2016 and September 2019. Futhermore, I used the same set of Search Console properties for both sample periods. This set represents websites for well established brands in mature markets with above average domain strength. Data for all queries with an average ranking position between #1 and #12 is included (I wanted to include the top of page two). Queries were then grouped into branded and non-branded. To keep it simple there is no categorization based on keyword intent or type of market although based on some additional analysis both of these dimensions impact CTR.
A note about the average ranking position metric: The Google Search Console API has a metric called position (formerly known in Webmaster Tools as avgPos) which is the aggregated average of the best ranking position for a website impression in a SERP result for a given query (the API uses query instead of keyword – as an SEO I use keyword). Since ranking position can change based on factors such as searcher’s proximity, this metric could be mis-leading if you were to use it solely as a ranking indicator.
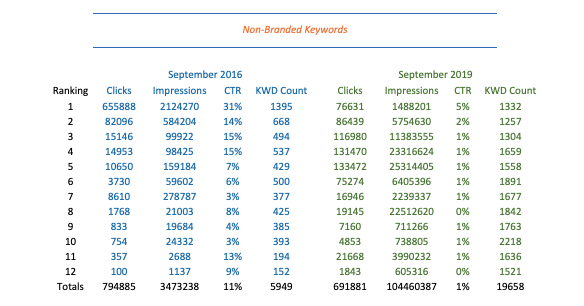
Non-Branded Keyword Data:
Non-Branded Keyword Analysis:
- There are fewer clicks on organic SERP results in 2019 than in 2016.
- For this data set, the number of keywords ranking #1 position remained consistent.
- The 2019 SERP has a more even distribution of keywords throughout the SERP (positions #2 – #12)
- There was an average 13% drop in non-branded keyword clicks from September 2016 compared to September 2019.
- For keywords ranking #1, #2 or #3, there was a combined 63% drop in clicks for non-branded keywords between the sample periods.
- For keywords ranking in the #1 position on Google the data shows there is an 88% drop in clicks for non-branded keywords.
- The high production ranking position has changed. In 2016, ranking position #1 had the highest click production. In 2019, the clicks to keyword count shows that positions #3, #4, and #5 have the best click productivity.
- The data shows that ranking position #11 is now more productive (keyword count to clicks) than ranking at the bottom of page one.
Since impression data being reported in Search Console is inconsistent between the two comparison periods, CTR is not a solid metric to use from this data. Instead, using the number of keywords and the number of clicks shows the following trends in Google SERP performance:
- Using the total number of unique keywords ranking between #1 and #12, and the total clicks these keywords generated shows a 73% drop in clicks per keyword from non-branded keywords between the two months being sampled.
- There are over three times the number of keywords impressed in positions #1 through #12 in 2019 than in 2016 – likely due to the enhanced SERPS with rich snippets, People Also Asked and other SERP features.
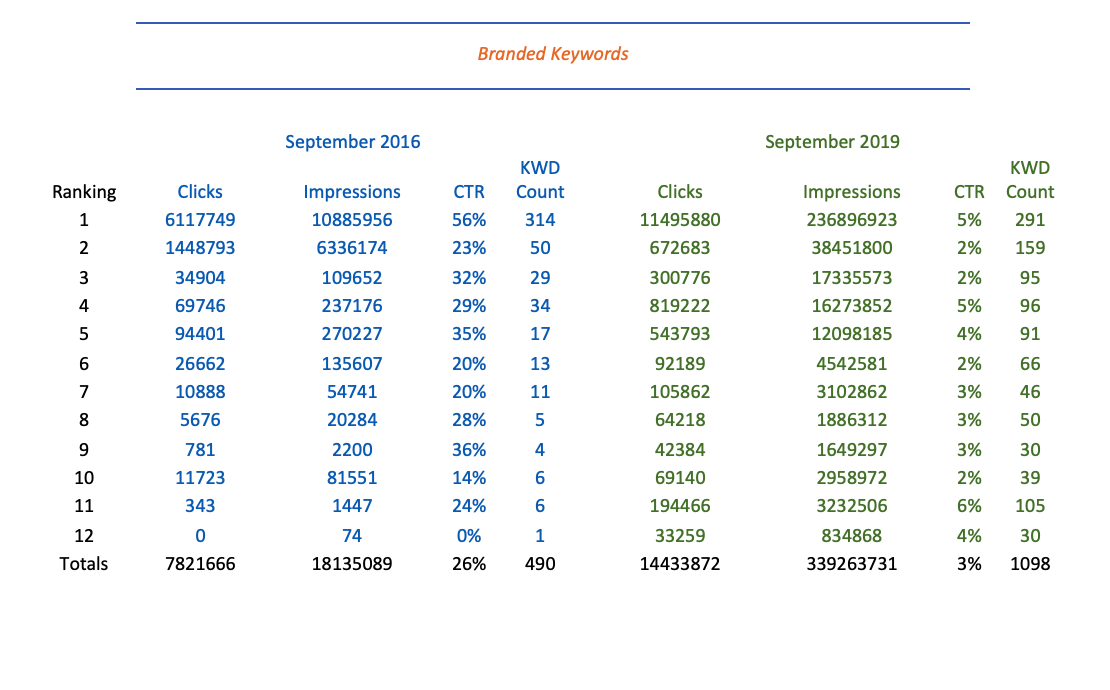
Branded Keyword Data:
Branded Keyword Analysis:
Based on this data it is clear that Google is favoring brands. Branded click production from the Google SERP has increased substantially.
- In 2016, most branded keywords came from the top two positions. In 2019 branded clicks are more distributed through the SERP.
- Keyword count for position #1 remained consistent
- Click productivity for position #1 is up in 2019 close to two times over 2016
- The average click productivity for positions #1 through #12 in 2019 is also up 1.8 times over 2016 numbers.


